Python - LinkedIn Analysis
This project analyzes LinkedIn data to explore an individual's professional online presence. The dataset provided by LinkedIn includes data points such as “First Name”, “Last Name”, “URL”, “Email Address”, “Company”, “Position”, and “Connected On”. With these data points, we can perform several analyses using Python, including:
- Total number of connections
- Most common companies
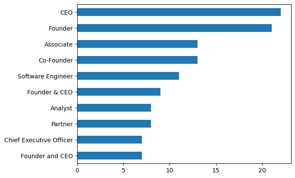
- Most common positions
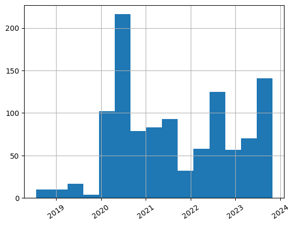
- Historical connection dates
- Availability of email addresses
The examples below utilize my dataset. My connections’ personal information such as names and emails have been excluded for privacy purposes.
Code:
import pandas as pd
import plotly.express as px
import matplotlib.pyplot as plt
import datetime
df = pd.read_csv("YOUR FILE HERE")
column_names = ['first_name', 'last_name', 'url', 'email_address', 'company', 'position', 'connected_on']
if list(df.columns) != column_names:
df = pd.read_csv("YOUR FILE HERE", skiprows=3, header=None, names=column_names)
df[:5]
## Total number of connections
num_connections = df.shape[0]
print(num_connections)
## TOP 10 COMPANIES
df['company'].value_counts().head(10).plot(kind="barh").invert_yaxis();
## TOP 10 POSITIONS
df['position'].value_counts().head(10).plot(kind="barh").invert_yaxis();
## DATE OF CONNECTED ON
df['connected_on'] = pd.to_datetime(df['connected_on'])
df['connected_on'].hist(xrot=35, bins=15);
## EMAILS
df = df.drop(columns="connected_on")
df[df["email_address"].notnull()]
To access your LinkedIn connections report, navigate to: Me → Settings & Privacy → Data Privacy → Get a copy of your data. You'll receive a download link in your inbox once the export is complete. While this dataset offers limited options for vizualizations, it serves as a valuable resource for extra insight into your connections, given that this level of analysis is not available through LinkedIn’s built-in functionalities.